Streaming data platform
Clickstream
A production-shaped clickstream pipeline built to test the full path from event generation to a monitored read API.
ScopePortfolio build using synthetic events and short-run local or kind-cluster measurements. Not an employer production system.
- producer throughput
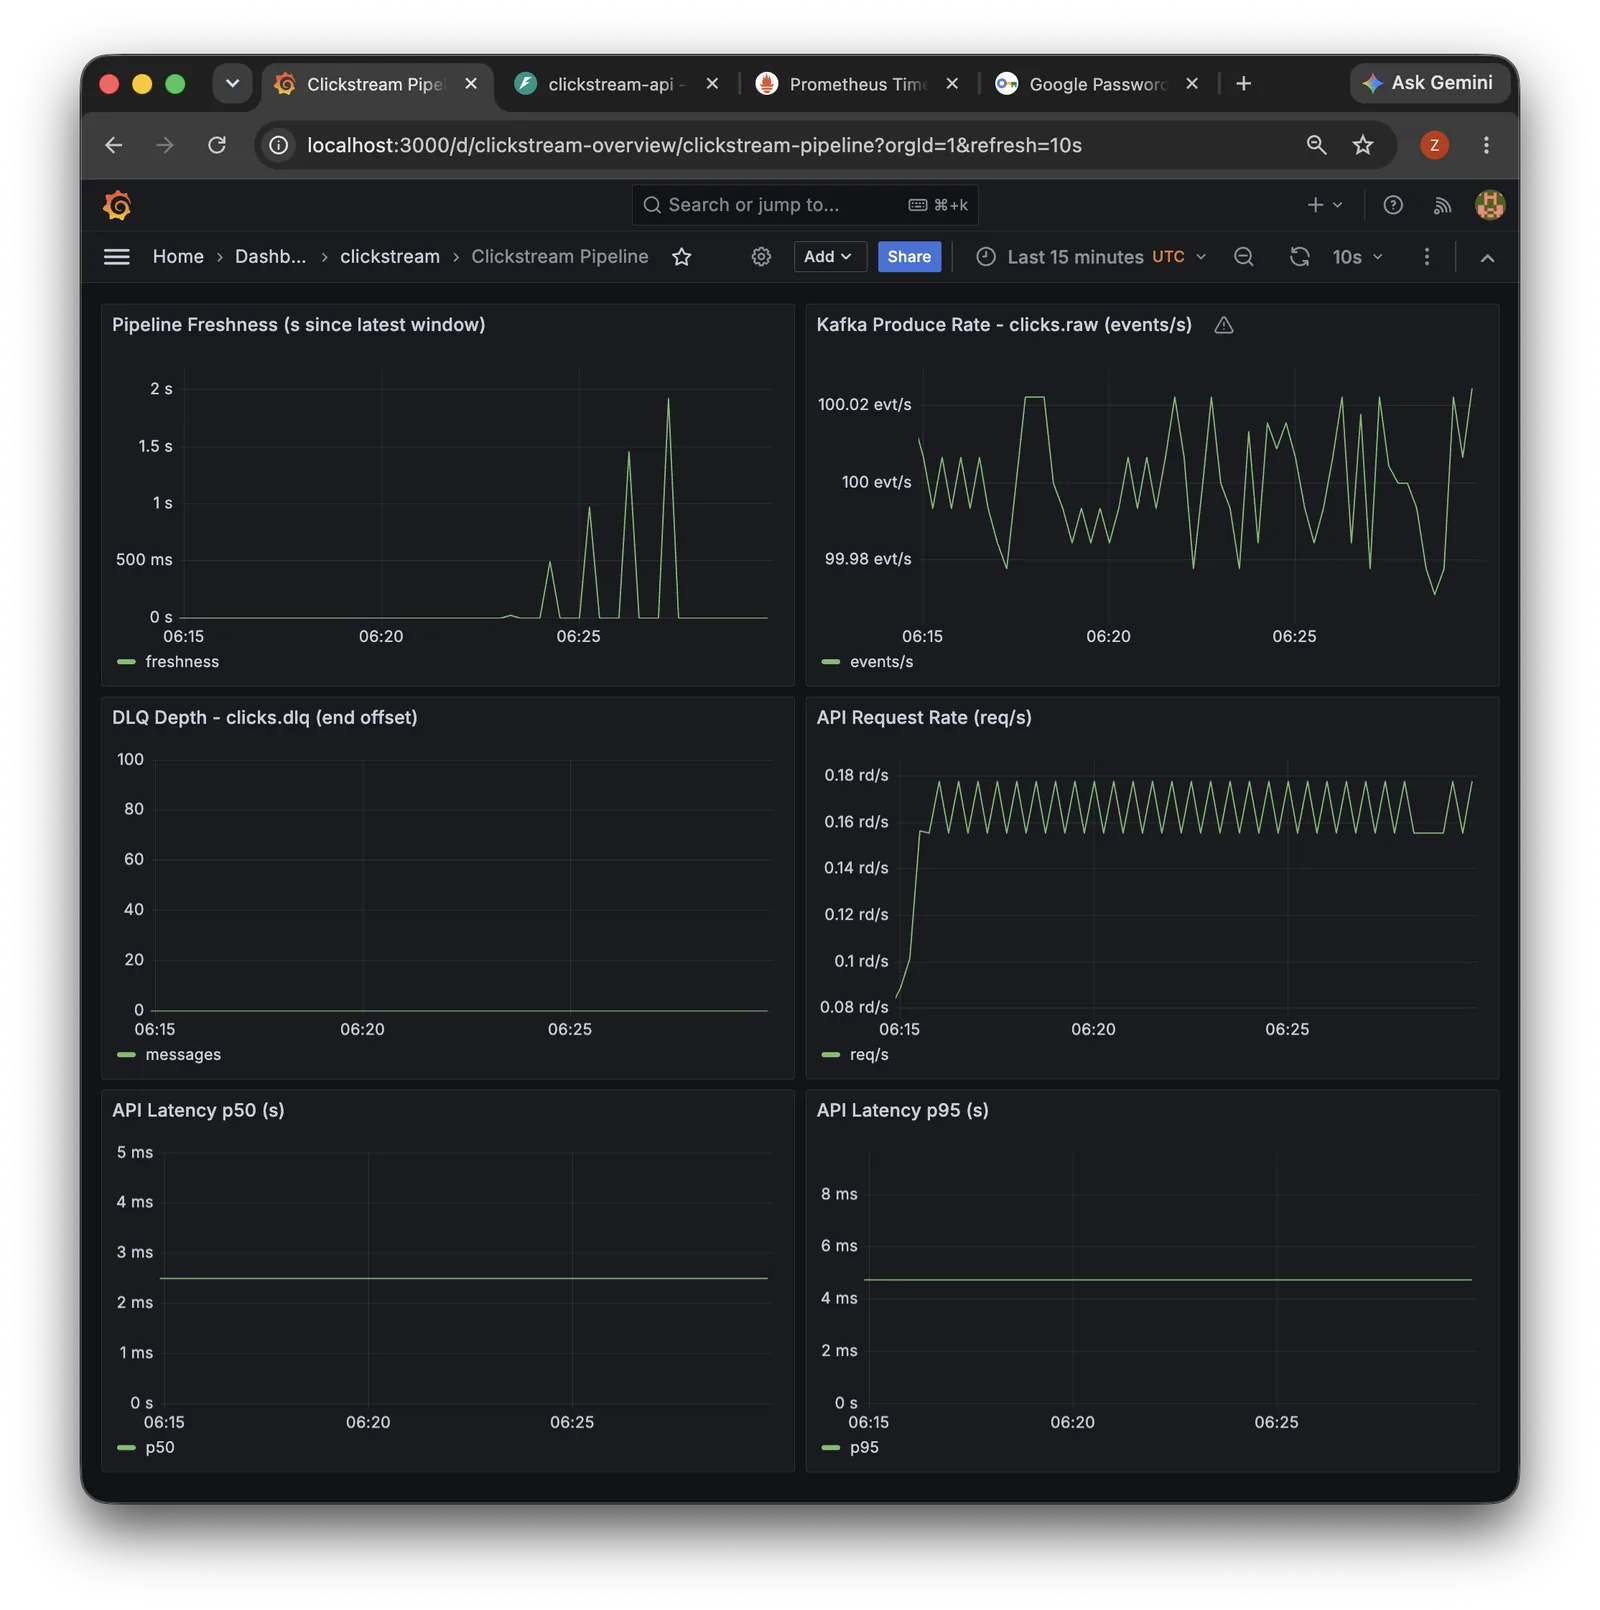
- ~100 events/s
- API under load
- p95 181 ms
- Python tests
- 111
- Python
- Kafka
- Spark
- PostgreSQL
- ClickHouse
- FastAPI
01 / Context
The problem
Streaming projects often stop at a dashboard. The harder question is whether the event contract, state model, query layer, and failure paths hold together when data is late, duplicated, malformed, or temporarily unavailable.
02 / Architecture
How the system fits together
- 01Producer~100 events/s
- 02Kafkaclicks.raw + DLQ
- 03Spark1-minute windows
- 04PostgreSQLcurated aggregates
- 05ClickHouseanalytics storage
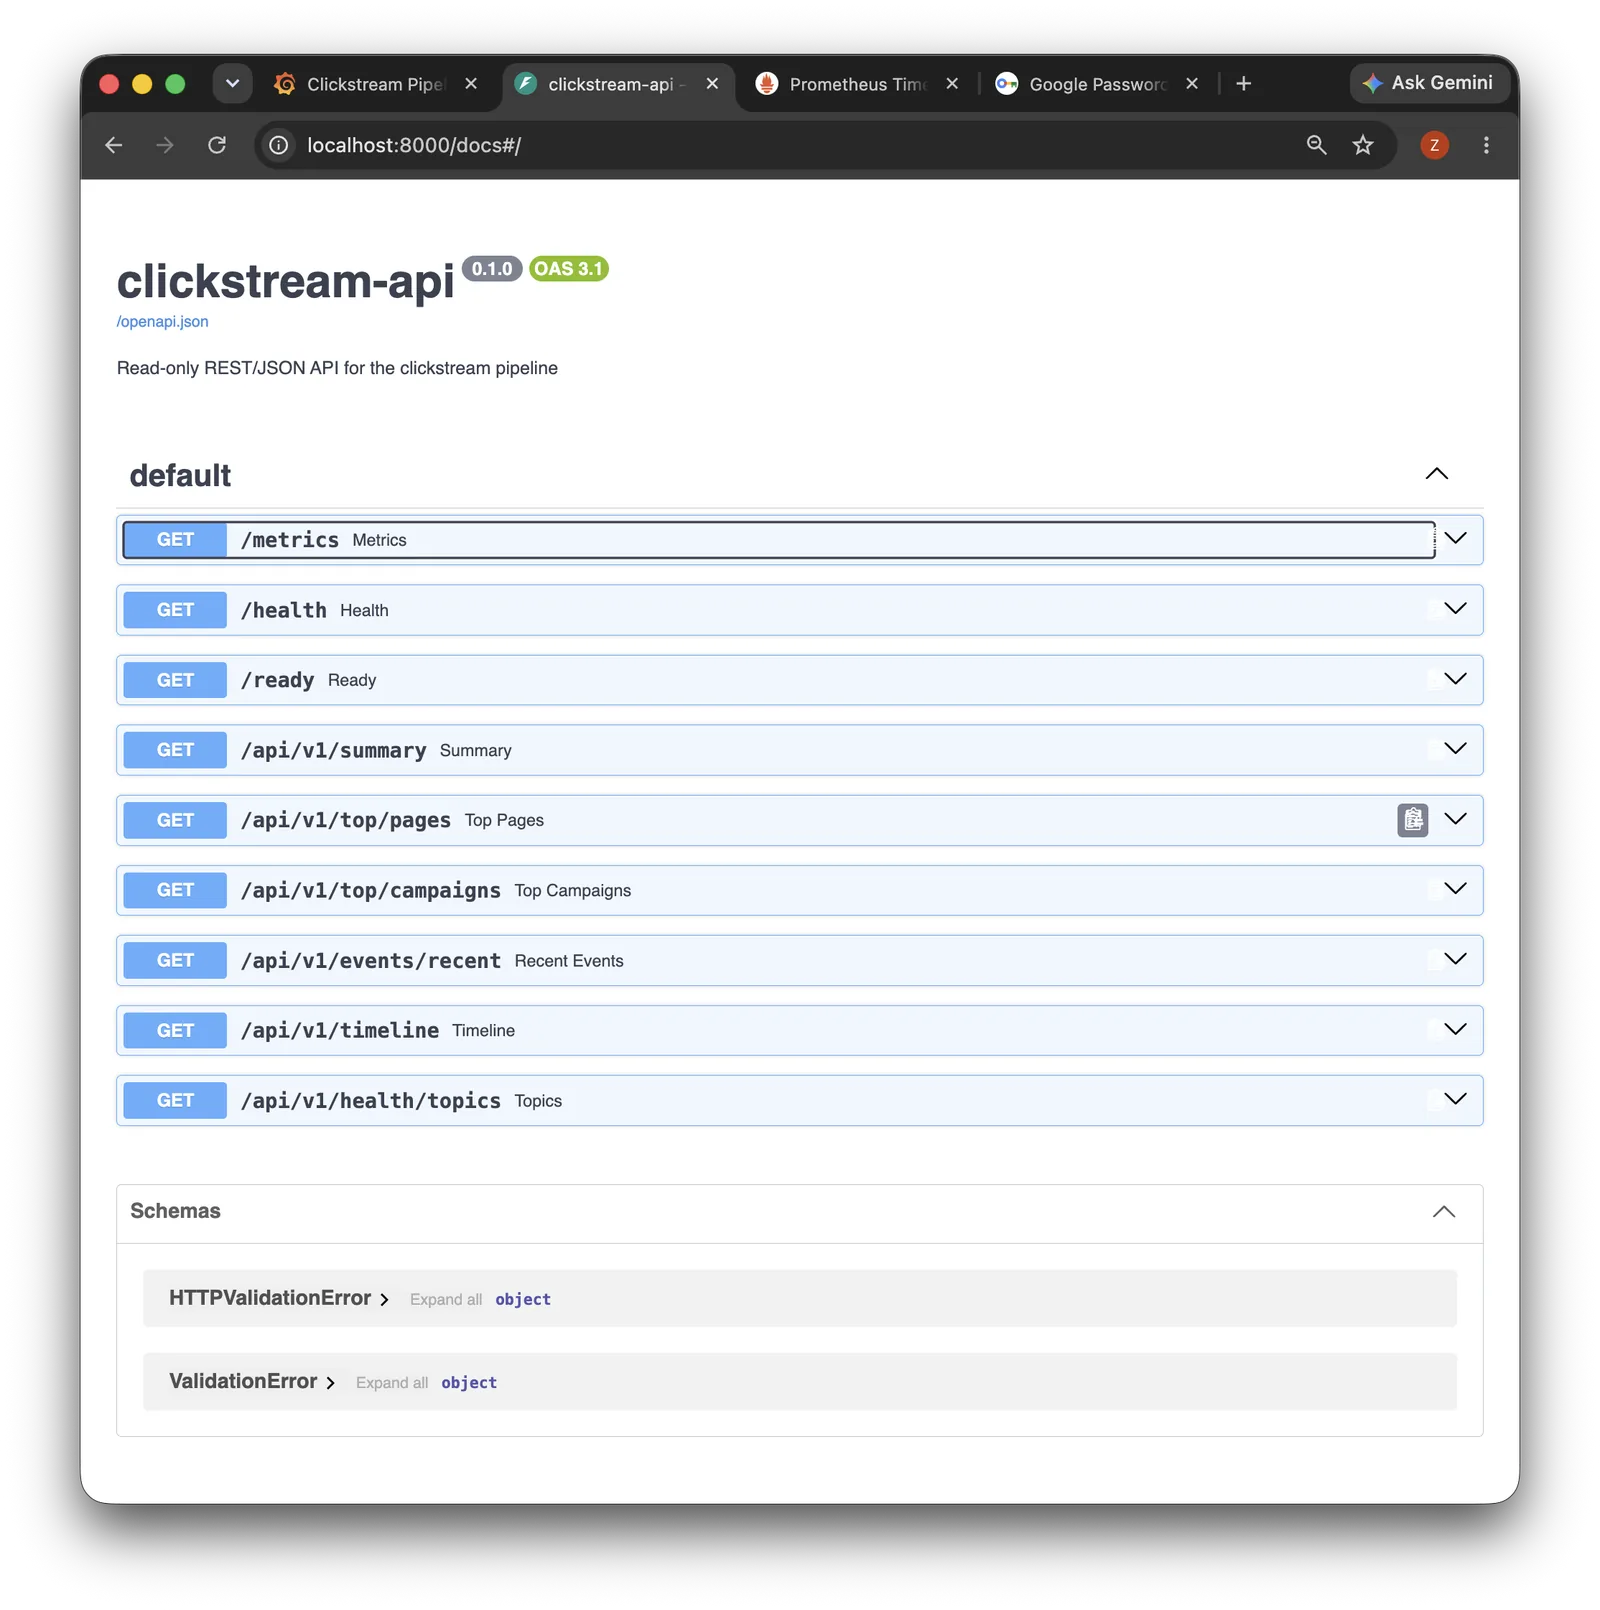
- 06FastAPIread-only API
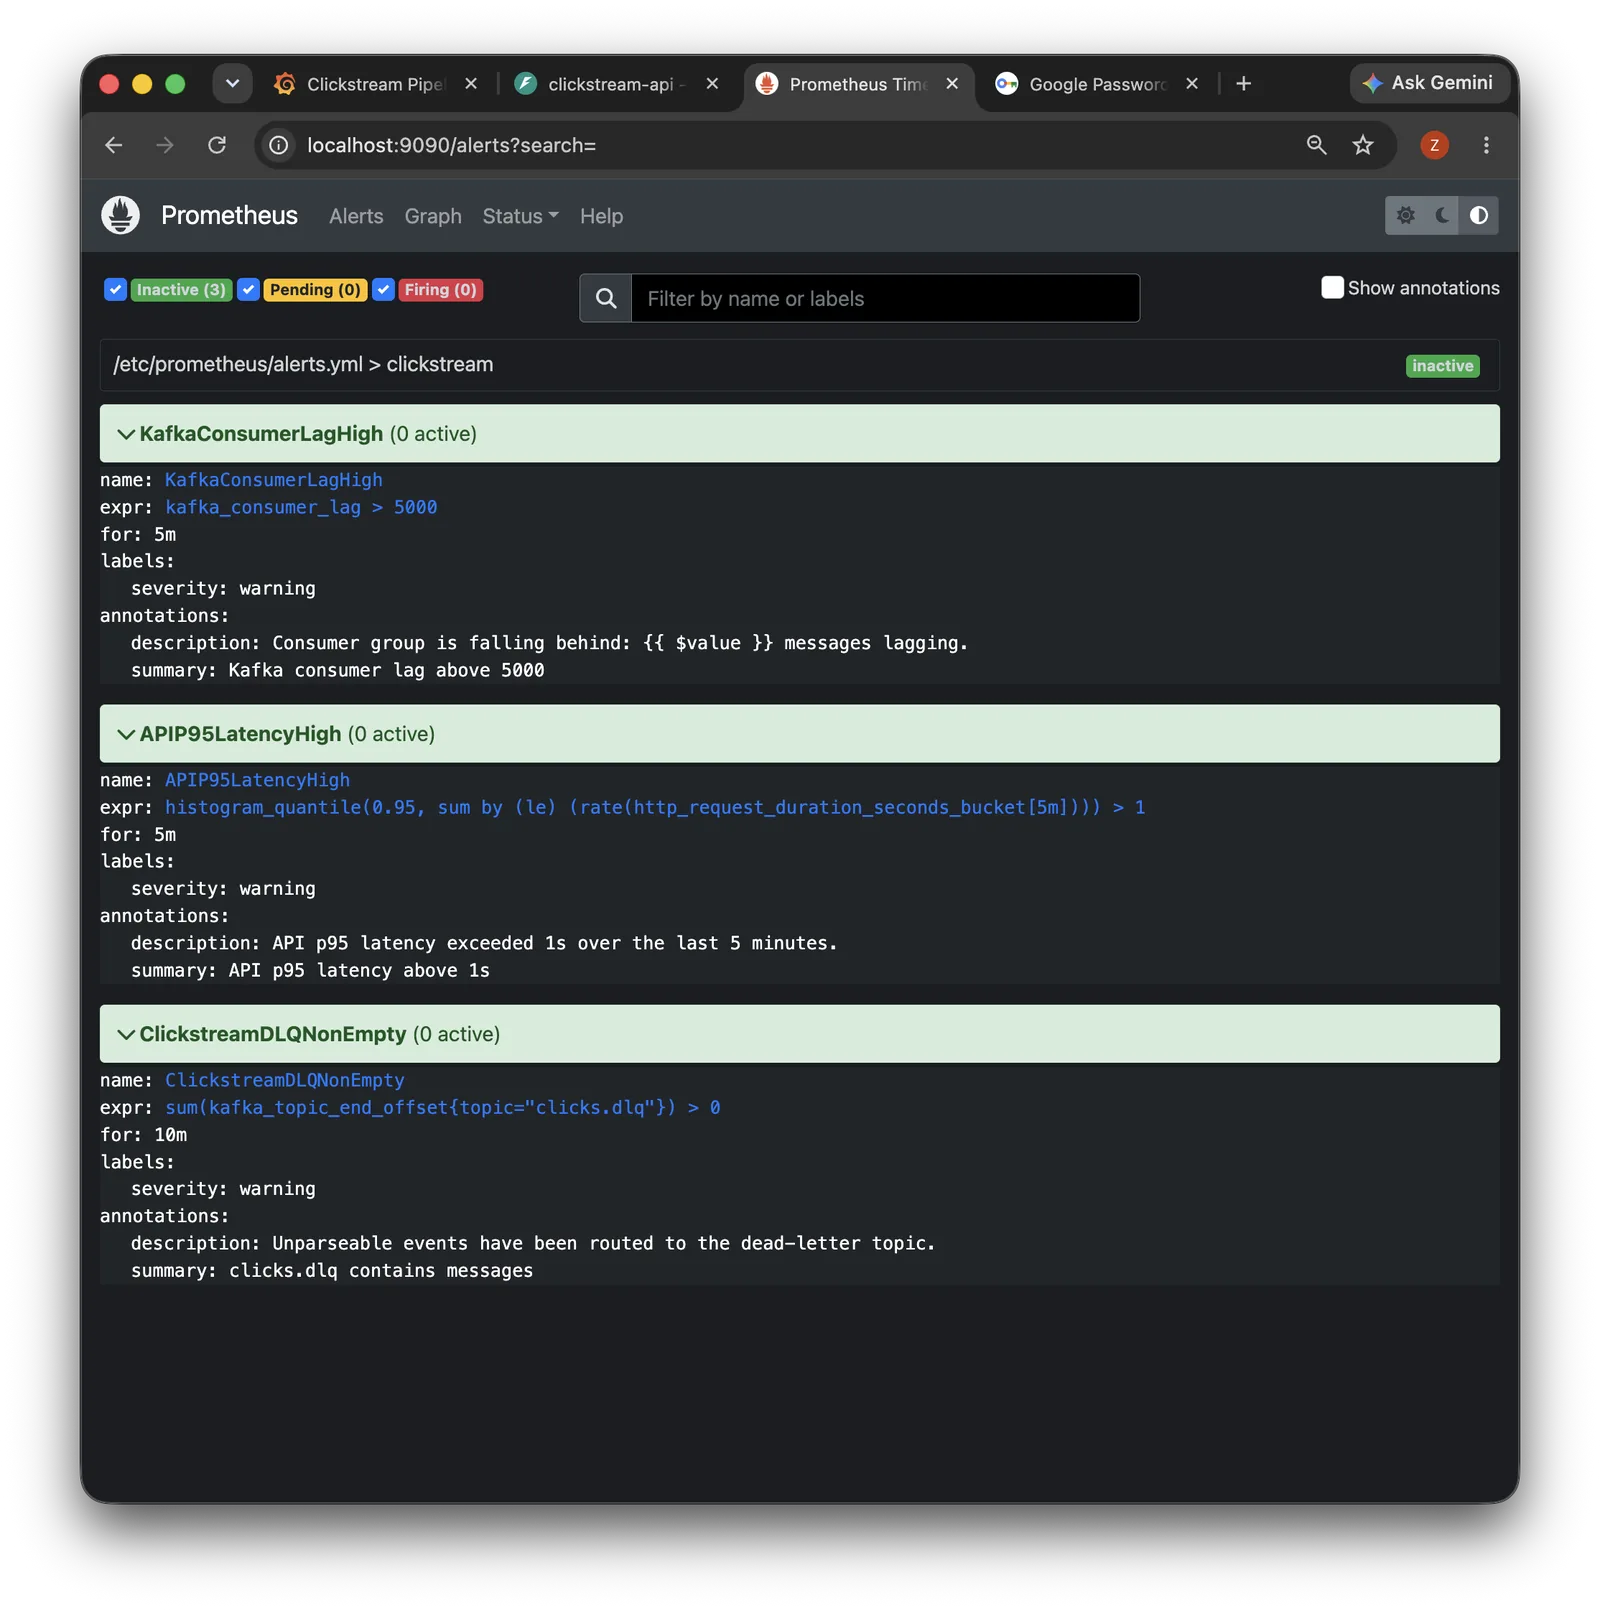
- 07GrafanaSLIs and alerts
Supporting systems
- Airflowfreshness and rollups
- dbtmodels and tests
- Sodadata-quality checks
- Terraform / EKStime-boxed cloud run
03 / Engineering
What I built
- Built a deterministic producer and Kafka ingestion path, then processed one-minute windows in Spark Structured Streaming with watermarking and a dead-letter topic.
- Modeled curated data for PostgreSQL and analytical data for ClickHouse, with idempotent upserts and a read-only FastAPI serving layer.
- Added Airflow orchestration, dbt models and tests, data-quality checks, Redis caching, rate limiting, and a Go operations CLI.
- Instrumented the system with Prometheus and Grafana, then added SLOs, runbooks, k6 load tests, and chaos drills.
- Deployed through Docker Compose and kind/Helm, with a time-boxed Terraform/EKS run that was destroyed in the same session.
04 / Evidence
Measured outcomes
steady-state producer
Zero failed events in the recorded run.
Clickstream README — measured metrics ↗API latency
46 requests/s with 0% errors in the k6 load test.
Clickstream README — Phase 4 ↗Python tests
Also 15/15 dbt tests and 11/11 data-quality checks passed.
Clickstream README — verification ↗chaos recovery
API and Kafka pod recovery time under kind.
Clickstream README — Phase 4 ↗05 / Demo
Product evidence
06 / Boundaries
Trade-offs and limitations
- The system uses synthetic events, a short measurement window, and a single-node Kafka configuration.
- It demonstrates production-shaped engineering, not production traffic, multi-region resilience, or a long-running SLO history.
07 / Sources